Success in personal injury law hinges on understanding the numbers behind the cases. Who is filing claims? What types of cases are most common? How long does it take to reach a settlement—and what are those settlements worth? Knowing the answers to these questions can help you make smarter decisions, improve case outcomes, and better serve your clients.
This article breaks down the latest personal injury statistics, giving you a clear view of the personal injury landscape. We’ll cover key insights on client demographics, case volumes, average settlements, payment timelines, and lead generation trends. Whether you’re refining your firm’s strategy or simply looking for a competitive edge, these insights will help you navigate the complexities of personal injury law with confidence.
Injury Demographic Statistics
Knowing the demographics of people who sustain injuries that may require personal injury services can help you shape your firm's marketing and messaging. It also helps you decide where to expand your practice geographically. Let's review age, gender, income, statistics of people who sustained injuries, and location data around personal injury cases.
1. Statistics around age and gender of potential personal injury clients:
- In 2023, 148,651 men sustained preventable, injury-related deaths. A total of 74,047 women died from avoidable injuries. The percentage breakdown is 66.8% men and 33.2% women. (National Safety Council)
- In 2023, more men than women had fatal accidental injuries between birth and age 85. The difference in the number of deaths by gender was most extreme between the mid-20s and mid-60s. At age 86 and beyond, more women died from preventable accidents than men. (National Safety Council)
- Fatal falls comprised 31.3% of all accidental injury-related deaths for women. The same number for men is only 16%.
2. Average income level for potential clients: Limited data available suggests that low-income individuals are more likely to suffer accidental personal injuries. A 2019 review concludes that most studies support a link between low socioeconomic status and childhood injury risk. (National Library of Medicine) A 2016 comprehensive study shows a higher prevalence of unintentional injuries in U.S. counties with high poverty rates between 1999 and 2012. (National Library of Medicine)
3. States with the most personal injury cases: Residents of the following five states file the most personal injury lawsuits per 100,000 capita. The data includes filings between March 2022 and March 2023. (Anidjar & Levine Accident Attorneys, quoted by Business Observer)
- Florida, with 127.41 cases per capita
- Ohio, with 30.38 cases per capita
- New Jersey, with 30.34 cases per capita
- South Carolina, with 30.12 cases per capita
- Illinois, with 22.95 cases per capita
4. Cities with the most personal injury cases: Car wrecks lead to more than half of all personal injuries in the U.S., according to the Law Offices of J.G. Winter. The U.S. cities with the most dangerous driving conditions, per a 2024 report, are below. (Forbes Advisor)
- Albuquerque, New Mexico
- Memphis, Tennessee
- Detroit, Michigan
- Tucson, Arizona
- Kansas City, Missouri
Personal Injury Industry Statistics
The size and growth of personal injury law provide important context for your firm. For example, you can compare your firm's performance on the personal injury statistics below to understand your role within the broader industry.
5. Personal injury law firm market size: In 2023, the market for personal injury lawyers and attorneys was valued at $57 billion. This value increased by 1.7% in 2023. (IBISWorld)
6. Largest personal injury law firms in the U.S.: (Law Fuel)
- Morgan & Morgan has recovered $25 billion for its clients. The firm markets itself as the largest personal injury law firm in the U.S., with more than 700,000 personal injury cases won. (Morgan & Morgan)
- Cellino Law has won $2 billion in settlements for clients. Personal injury cases won include a $47 million settlement for a client who sustained permanent brain damage and a $12 million settlement for a client who was left with severe burns. Both cases involved car accidents. (Cellino Law)
- The Barnes Firm has recent case awards ranging from $300,000 to $3.6 million. (The Barnes Firm)
- Goldberg, Persky & White P.C. has recent case awards ranging from $2.2 million to $4.5 million. (Goldberg, Persky & White P.C.)
- Simmons Hanly Conroy LLC secured history's largest mesothelioma verdict of $250 million. (Simmons Hanly Conroy)
7. Number of personal injury lawyers in the U.S.: In 2023, there were 164,559 personal injury lawyers in the U.S. (IBISWorld)
Personal Injury Settlement Statistics
Personal injury lawsuit statistics vary widely based on settlement type. Claim type is a primary factor influencing settlement amounts, success rates, and case durations. Let's review these personal injury lawsuit statistics for the most common claim types: car accidents, medical malpractice injuries, slip-and-fall incidents, and defective product issues.
Motor Vehicle Accidents
8. Average case settlement amount for motor vehicle accidents: From a sample of 4,500 cases, law firm Brown & Crouppen estimates the average settlement amount for car accident cases is $37,248.62. (Brown & Crouppen)
9. Average lawyer compensation for motor vehicle accidents: Lawyers charging fees of 30% to 40% of the average settlement amount above would receive compensation of $11,174.59 to $14,913.85 on a car accident case. (Price Benowitz)
10. Average insurance payout for motor vehicle cases: In 2022, the average auto liability claim for bodily injury was $26,501. (Insurance Information Institute)
11. Average case duration for motor vehicle cases: Straightforward motor vehicle cases often settle six to nine months after medical treatment is completed. Complex cases can take much longer. (Brown & Crouppen)
Medical Malpractice Claims
12. Average case settlement amount for medical malpractice claims: The National Practitioner Data Bank reports 10,217 medical malpractice payments in 2024, totaling $4.328 billion. That equates to an average payment of $423,607. (National Practitioner Database) However, cases that go to jury trial tend to have larger settlements. For example, the average jury trial award for medical malpractice cases in 2020 was $1.8 million. (Insurance Information Institute)
13. Average lawyer compensation for medical malpractice cases: Nolo reports an average medical malpractice attorney fee of 33%. This rate applied to an average payment of $423,607 equals an estimated lawyer compensation of $139,790.31. (Nolo)
14. Success rates for medical malpractice cases: Data on success rates for medical malpractice cases vary. A Nolo survey concludes that 30% of respondents who hired an attorney received an award. (Nolo) A report from the American Medical Association indicates that only 25% of cases ended with a settlement. (AMA)
15. Average case duration for medical malpractice cases: Medical malpractice cases can take two to three years to settle. Cases that go to trial may take four years or more to resolve. (Brown & Crouppen)
Slip-and-Fall Incidents
16. Average case settlement amount for slip-and-fall accidents: Settlements on slip-and-fall cases can range from $10,000 to $150,000. (CASEpeer)
17. Average lawyer compensation for slip-and-fall accidents: Lawyer fees on slip-and-fall cases are usually 25% to 40% of the settlement amount. This implies a total compensation of $2,500 to $60,000, depending on the case complexity and injury severity. (Law Offices of Vincent J. Ciecka)
18. Success rates on slip-and-fall accident cases: By one estimate, 95% of slip-and-fall cases settle before going to trial. (Smith Law Center)
19. Average case duration for slip-and-fall accidents: Slip-and-fall cases can take three to 18 months to resolve. (Smith Law Center)
Product Liability Cases
20. Average case settlement amount for product liability cases: Product liability cases have the highest personal injury settlement statistics. Considering product liability cases that went to jury trial in 2020, the average settlement award was about $7 million. (Insurance Information Institute) Cases settled before trial produce smaller settlements, from $10,000 to $500,000, depending on injury severity. (CASEpeer)
21. Average lawyer compensation for product liability cases: Defense costs in product liability cases averaged $869,370 in 2023. (Insurance Information Institute)
22. Success rates on product liability cases: Roughly two-thirds of product liability cases end with a settlement for the plaintiff. (Lex Machina, quoted by Insurance Canopy)
23. Average case duration for product liability cases: Product liability can be resolved in one to three years. Cases that go to trial take the longest, with an average of 886 days for the case to reach the trial phase. (Lex Machina, quoted by Insurance Canopy)
Personal Injury Practice Management Statistics
How does your personal injury firm stack up on expense management, payment timelines, and lead management? See the industry’s expense and lead averages outlined below.
Financial Statistics
24. Average number of expenses for personal injury cases: Personal injury lawyers record an average of 181,064 expenses. This ranks among the highest of practice areas, above trust and estate attorneys and real estate lawyers. (MyCase 2024 Benchmark Report Part 1: Law Firm Finances)
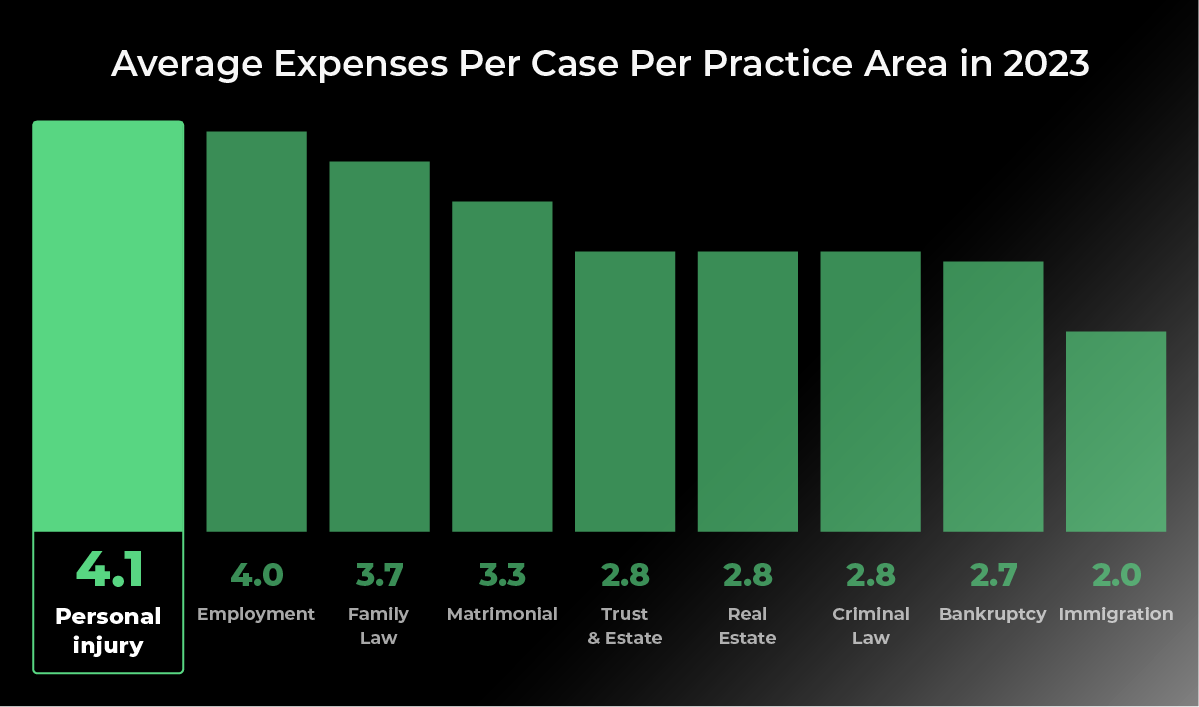
25. Average expenses per personal injury case: Every personal injury case incurs 4.1 expense types on average, indicating a costly and complex case management process. For context, family law cases incur 3.7 expense types, and criminal law cases incur just 2.8 expense types. (MyCase 2024 Benchmark Report Part 1: Law Firm Finances)
26. Personal injury law firm time to payment: Personal injury firms take 184 days on average to get paid. This is the longest first payment timeline across practice areas and a function of contingency-based fee structures. (MyCase Benchmark Report Part 2: Getting Clients)
27. Top three expense categories for personal injury: (MyCase 2024 Benchmark Report Part 1: Law Firm Finances)
- Medical records are the costliest expense category in personal injury cases.
- Postage fees related to document handling, case filings, and client correspondence are the second-largest expense category.
- Unspecified costs are the third largest expense category. The prevalence of uncategorized costs suggests an opportunity to improve expense tracking within personal injury firms.
Client & Lead Statistics
28. Average lead conversion time: Personal injury firms have the fastest lead conversion time across practice areas. On average, personal injury firms convert leads into clients in three days. (MyCase Benchmark Report Part 2: Getting Clients)
29. Number of leads generated: In 2023, surveyed personal injury firms generated 36,255 leads, producing 2,559 consultations. (MyCase Benchmark Report Part 2: Getting Clients)
30. Rate of consultations set from leads: Just 7% of personal injury firm leads set consultation appointments. This is the lowest across practice areas. The average across all practice areas is 14%. Trust and estate attorneys make the most of their leads, setting consultations for 27% of them. (MyCase Benchmark Report Part 2: Getting Clients)
How CASEpeer Supports Personal Injury Lawyers
If these statistics on the personal injury industry highlight areas where your practice could improve, consider CASEpeer as a solution. CASEpeer is the top-rated all-in-one practice management solution for personal injury lawyers. Features that can optimize lead conversion times, expense management, and settlement timelines include:
- Automated lead collection and intake: Optimize every opportunity by automatically tracking and following up with leads. With a complete record of every communication, from initial contact to signed contract, you can analyze and improve your lead management process for more conversions with less effort.
- Fee and expense monitoring: Streamline financial oversight with easy and real-time monitoring of case expenses, settlements, and fees. Make better financial decisions with improved cash flow visibility.
- Automated settlement and payout management: Keep your financial records clean and your clients informed via automatic tracking of offers, liens, and disbursements in one system.
Schedule a demo today to learn how CASEpeer can help your firm exceed industry averages and achieve new levels of success.